Price action in the financial markets as shown on the charts do not fall into straight line graphs. Rather, the movements surge and ebb like the waves of an ocean, with the highs and lows of such movements forming peaks and troughs that actually fit into percentages.
This is the basis of the use of percentages in determining the points of maximum retracements, which usually precede renewed price moves in the direction of the original waves.
The use of percentages in determining retracement points is entirely a price action move which requires no indicators. If you can do simple Mathematical calculations that involve some addition, subtraction and multiplication of percentages, then you are good to go with this strategy.
How Does This Strategy Work?
It has been found over time that any retracements in price commonly occur to the following percentage areas of the original move:
- 50% of the original move (i.e. half of the original move)
- 67% of the original move (i.e. two-thirds of the original move).
In order to calculate the price levels that match the 50% and 67% retracement areas of the original trend, the trader needs to identify the price levels that correspond to the swing lows and swing highs and perform the percentage calculation.
The essence is to do a trace of the swing high to swing low in a downtrend, get the retracement points and the price levels that match these points. In an uptrend, you would do a swing low to swing high trace, get the price levels, calculate the distance between both price levels and work out the percentages.
Time Frames Used
The retracement areas can be detected on time frames that depict the major trend, minor/secondary trend or the short-term trends. These correspond to the following time frames:
- Major trend (weekly or monthly time frame charts)
- Minor trend (daily chart)
- Near-term trend (4-hour chart)
The Strategy
The strategy will be discussed within the context of the setup itself, as well as from a risk management perspective. The trade can be opened with any forex or a CFD broker.
Long Entry
The concept is to go long when the initial trend is upwards, with a retracement move to the downside.
- Pick a swing low (the commencement price of the initial uptrend) and note the price.
- Identify the swing high (the pause of the initial trend and the start of the retracement) and note the price.
- Subtract the lower price from the higher price, then calculate what 50% and 67% of it will be.
- Deduct the result from the calculation above from the swing high. This gives you the 50% and 67% retracement points where you can set your long trade.
Look at the chart below for an illustration of the setup.

Look at the snapshot above. The starting point of the uptrend (i.e. the swing low is at 1.03716. The swing high at a certain date in July 2019 was at 1.08450. The pip distance between both points is 0.0473 points or 473 pips.
50% of this value is the halfway mark, so we divide 0.0473 by 2 to get 0.0236. The 67% value of the distance between the swing low and swing high points is calculated to be 0.03156.
These values are then deducted from the swing high, since the retracement is against the trend and therefore moves from the swing high downwards. This leaves the entry points for the 50% move at 1.0609 and 1.0529.
So the way to go is to set Buy Limit orders at the two possible entry points. Eventually, the retracement entry fit into the 50% mark as can be seen above.
In setting the stop loss, you set two of them. The first one should be a tight stop loss below the 50% retracement point, while the one below the 67% retracement point can be set more liberally, ensuring that your account is well capitalized to handle the stop loss.
Ideally, the value of the stop loss below the 67% retracement should be 1.5% to 2% of your account. If the 50% trade is triggered and the price continues to move towards the 67% mark, the tight stop loss will be triggered, allowing you to take a small loss.
Usually, the price has a greater chance of triggering the entry at the 67% price level. If the trade works in your favour, the price move would be enough to cover the initial small loss.
Short Entry
The strategy is to short the currency pair in a downtrend, with a retracement move to the upside.
- Detect the swing high (the commencement price of the initial downtrend) and note the price.
- Identify the swing low (the pause of the initial trend and the start of the upside retracement) and note the price.
- Subtract the lower price from the higher price, then calculate what 50% and 67% of it will be.
- Add the figure obtained to the swing low. This gives you the 50% and 67% retracement points where you can set your short trade.
Look at the chart below. The swing high here is 1.6140 and the swing low is 1.4996. The distance between both points is 0.1144. The value of 50% of 0.1144 is 0.0572, while 67% of that value is 0.0767.
In this instance, you would add this number to the swing low, since the retracement goes away from the swing low to the upside. This puts the price levels for the 50% and 67% retracement areas at 1.5568 and 1.5763.
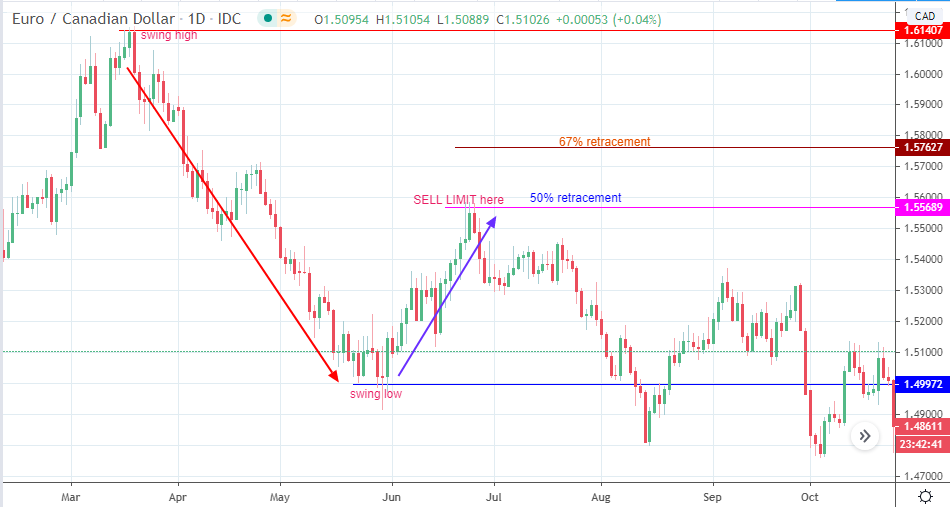
Once the retracement price areas are identified, they are marked on the charts and a Sell Limit order is set at both levels. The one of the 50% level is triggered first.
If the price starts to show a renewal of the downtrend move, close the Sell limit order set at the 67% retracement level and run with the triggered order. If the price continues beyond the order at the 50% level, allow it to trigger the tight stop loss.
You can then wait for the 2nd order to be triggered. If it works out in your favour, you will cover the initial loss made on the 1st position.
Improving the Chances of Success
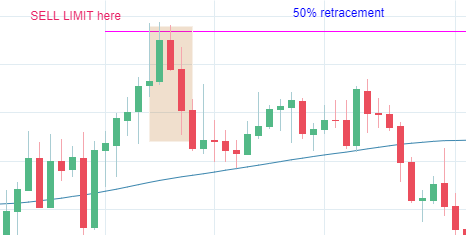
The candlestick patterns will usually indicate whether a trade entry has a great chance of success or not. For instance, we can look at the short entry setup, which was spot on at the 50% retracement price level.
The candlestick pattern was that of a three inside day pattern, which features a bullish candle engulfing a bearish second candle, followed by a third bearish candle which closed below the bullish candle to produce the pattern.
Other ways of confirming the entry involves the use of indicators. The Stochastics oscillator, with setting adjusted to 5,3,2 has good success rates.