In a way, technical analysis indicators are keys to solving a puzzle and to get the whole picture you need to put all the pieces strategically together.
There are grossly four types of indicators and each of them gives you a specific perspective of the Forex market.
That said, this article will briefly discuss 5 essential indicators that form the baseline of Forex trading, from which a novice trader can evolve into an expert or a funded trader with solid knowledge and skills.
1. Trend Indicators
Trend indicators tell in which direction the market is headed. In other words, if you’re trying to figure out whether the market is in an uptrend or downtrend, trend indicators will reveal that information.
Most traders are trend traders, as a result, they buy in an uptrend when prices are low and as soon as the trend reaches its peak and signs of a reversal become apparent, they sell their currency.
The following are the most common trend indicators to operate in the Forex market:
a. Moving Average (MA)
Most currency pairs are subject to lots of short term volatility that blurs your vision and makes it hard to identify a clear trend. As a way to cut out all the noise, Simple Moving Averages are used.
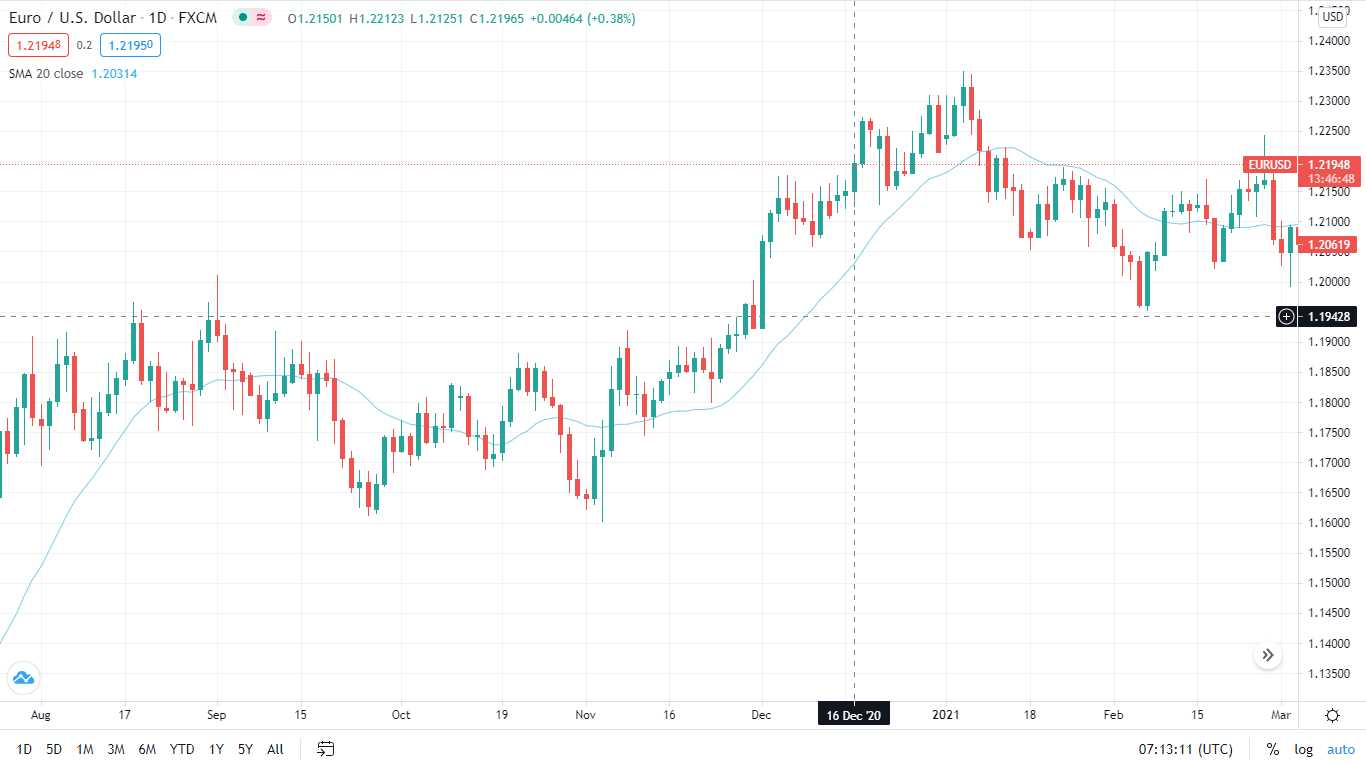
Chart 1.a: Moving average
A Simple Moving Average is a line connecting the average closing prices of a currency for a set period of time. It allows you to graphically see whether the exchange rate is going up or down on average.
b. Exponential Moving Averages (EMA)
These are very similar to the simple Moving Average; in fact, they are used for the exact same objective. Exponential Moving Averages, just like Simple Moving Averages, aim to provide a smoothed out picture of the trend line to give you a clearer view of market behavior.
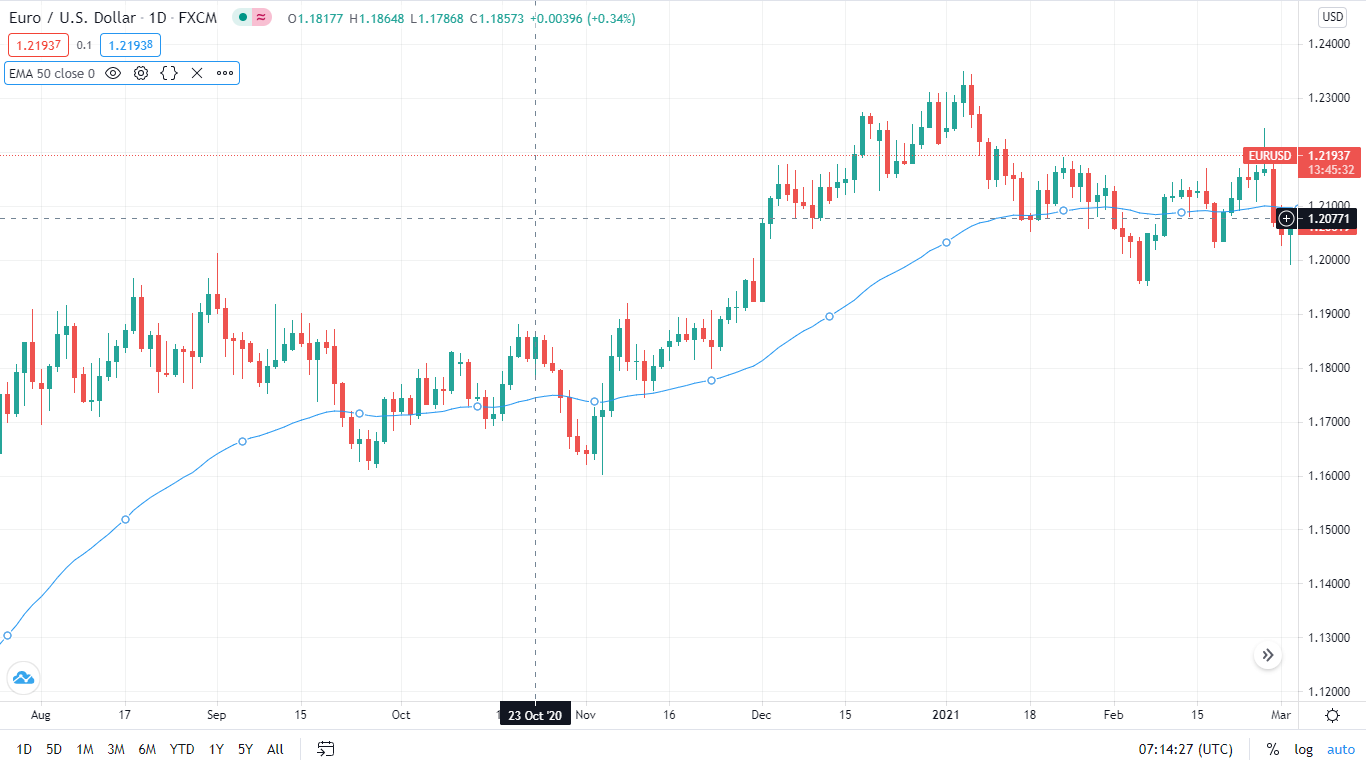
Chart 1.b: Exponential Moving Average
The only difference is that EMAs shift faster as a result of real-time price changes. Simply put, it offers a more updated view of the market.
2. Momentum Indicators
Every trader should be able to tell how fast currency prices are changing, and this information is used as either confirmation of current market behavior or as part of a trading strategy.
One of the most effective momentum indicators is the MACD – Moving Average Convergence Divergence:
a. Moving Average Convergence Divergence (MACD)
It’s worth noting that indicators aren’t always used on their own, they’re usually combined with other indicators. That is the case of the MACD indicator.
It comprises two exponential moving average lines, typically a 26-day and a 12-day EMA, the MACD line, and finally a signal line drawn on top of the MACD line.
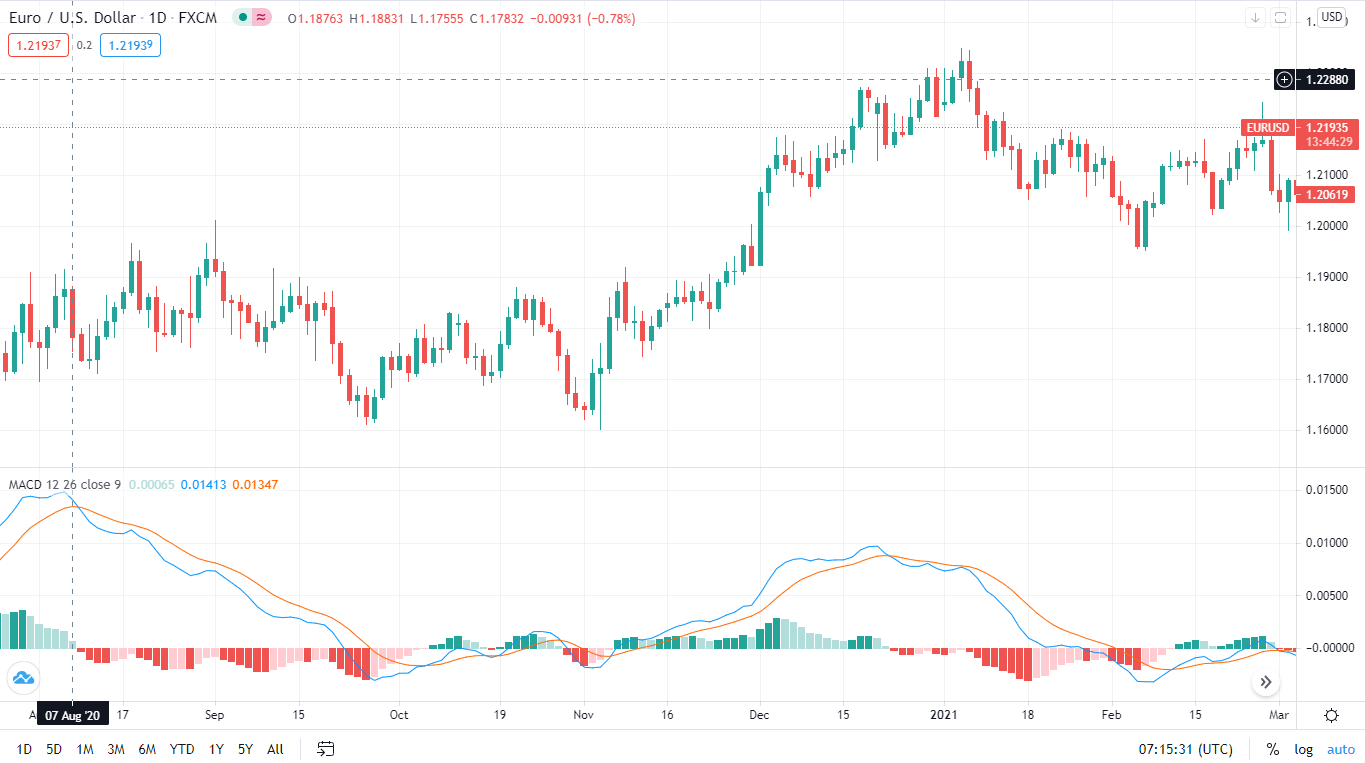
Chart 2.a: Moving Average Convergence Divergence (MACD)
Periods of high momentum are identified when the MACD line crosses above the signal line.
This is one of the most widely used indicators and it allows traders to identify when bullish or bearish momentum is high.
3. Mean Reversion Indicators
In a nutshell, mean reversion indicators tell you how far the price of a particular currency is from its average price in either direction. Furthermore, mean reversion may also be used to measure other market aspects such as volatility.
Here’s a popular mean reversion indicator:
a. Bollinger Bands
Just like the MACD, Bollinger Bands consist of other indicators that makeup the famous bands.
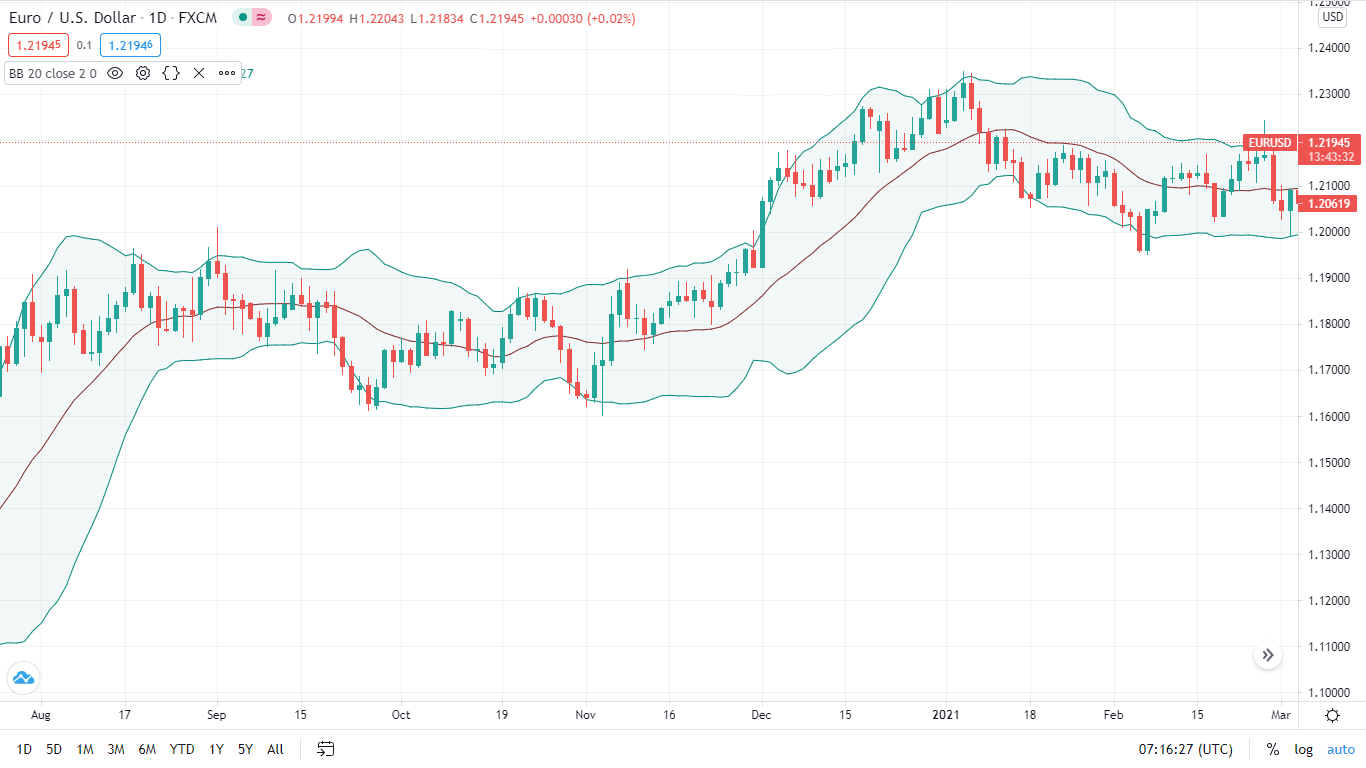
Chart 3.a: Bollinger bands
They’re made of 3 lines; a simple moving average line and a lower and upper band.
Bollinger bands are mostly used to offset overbought and oversold signals. Traders believe that once a market is overbought, as indicated by a movement of prices closer to the upper band, a mean reversion will occur, forcing prices to move back to the average price.
An oversold market on the other hand, is depicted by a movement of prices to the lower band.
4. Volume Indicators
Volume is a crucial aspect of technical analysis, simply because it’s undoubtedly the most effective way to gauge market interest, a key aspect when trading currencies.
The vast majority of traders understand the principle of buying low and selling high. However, even though this is normally the goal, it’s not as straightforward as it sounds. Additional factors could be driving market prices high or low, in which case buying or selling will be extremely challenging.
For that reason, traders use volume indicators as a way of confirmation that there are enough buyers or sellers to fulfill their orders and also that there is significant market interest to keep a trend going for a reasonable amount of time.
You’ll need the following indicator to gauge standard volume:
a. Volume by Price Charts (VBP)
It’s a common practice for technical analysts to include volume charts or histograms right underneath a standard candlestick chart. The VBP charts show the volume of a given amount of currency being traded at a specific price level.
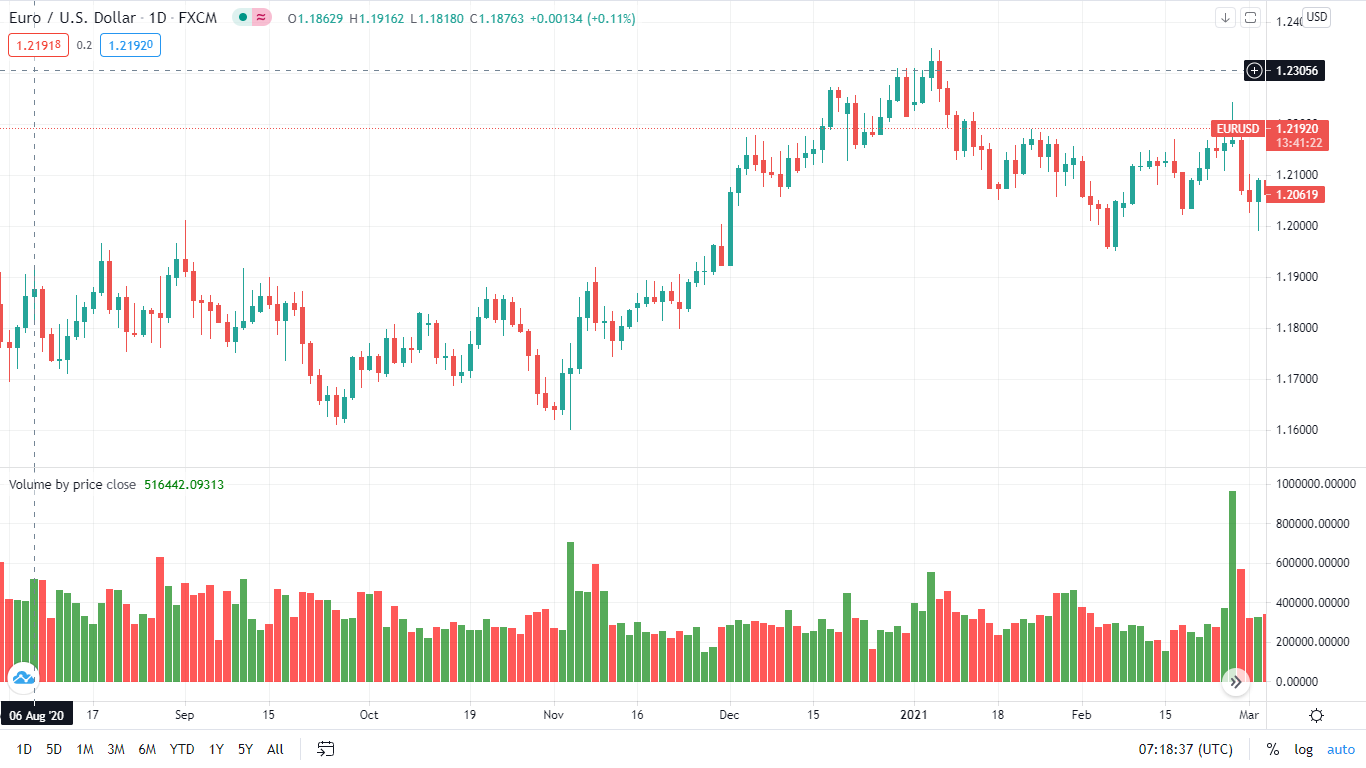
Chart 4.a: Volume by Price Charts (VBP)
These charts are used by technical traders to predict areas of support and resistance.
Final words
Now you have a clearer idea of some of the most widely used indicators in Forex trading. Start practicing their use, but don’t forget that you’ll need fundamental analysis in conjunction with your trading strategy to yield better results.
In Forex trading, it’s crucial that you take a look at fundamental factors such as a country’s gross domestic product, consumer price index and retail sales to help you gain a more in-depth understanding of a currency’s value.
By doing this you will be able to anticipate price movements of a specific currency pair.