How do you make a killing in the forex market? Simple: by knowing when to enter and exit a trade. Everything else is just details.
The forex market is very exciting. It’s a 24-hour global market with a daily transaction volume of over $5 trillion that excites even bank owners and heads of states.
Regrettably, new traders get trapped into this excitement and think that to beat the odds, they need a complex system.
This couldn’t be further from the truth. Keeping things as simple as possible creates clarity and enhances chances of profitability.
Simple strategies allow for faster reactions, seamless trades, and less stress. One of the best ways to keep your trading strategy simple is to include forex chart indicators.
What Are Forex Indicators?
A forex Indicator is a technical signal derived from mathematical computations to describe asset parameters. In this case, the asset is a currency pair and its relative price movement against time.
Indicators are used to study past price movements and for effectively predicting future prices and trends.
Benefits of Forex Indicators
There are many different types of indicators, and all of them have specific benefits to forex traders.
Some common benefits include:
- Indicators help traders accurately forecast new trends and future price movements.
- There are many different indicators, each suitable for a particular time frame such as intraday trading, short term trading, long term trading, and scalping. Whatever your trading style, there are indicators to support it.
- Indicators provide reliable signals for entry and exit point confirmation. They may not be a magic bullet to protect against losses, but they’re critical for a profitable trading strategy.
How to Install Forex Indicators on the MetaTrader Platform
To use your chosen technical indicator, you need to add it to your chart.
On the MetaTrader platform, go to the standard menu and click on the “insert” button. After that, click on the “Indicators” button to access the full list.

You may also access this list by clicking on the “Indicators” button on the Navigator window. Once you pick your choice, drag and drop it into the chart or execute the “Attach to a chart” command.

Also, right within the MetaTrader platform, you can access the MetaTrader market with hundreds of technical indicators. You can either buy, rent, or get an indicator free of charge.
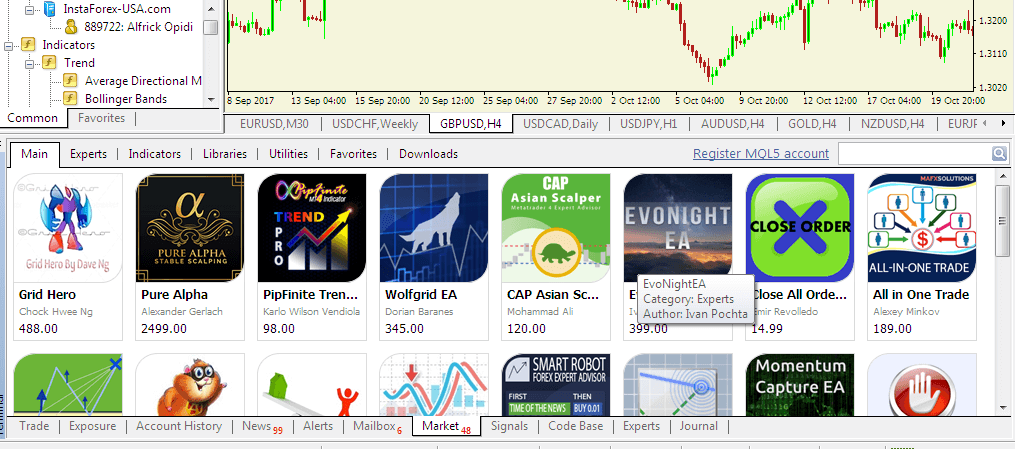
The full version of most indicators come at a premium fee. The charged amount depends on the indicator’s efficiency, popularity, and the credibility of its maker.
If you can’t afford the full version or you are not ready to purchase without prior testing, you can rent the full version for a limited time.
Alternatively, you can test out the free version which may not have all the full-version enhancements.
For novice traders, it’s advisable to start out with the free indicators before graduating to the more advanced ones.
The MetaTrader Market accepts multiple secure payment types, including Visa, MasterCard, Neteller, PayPal, and WebMoney.
Common Types of Forex Indicators and How To Use Them On MetaTrader
There are several types of indicators. This is because anyone with some programming expertise and forex market knowledge can create a customized indicator.
For instance, the MetaTrader Market has at least 2,100 technical indicators.
Nevertheless, most indicators are derived from the following five most popular and commonly used forex indicators:
-
Momentum indicators
The momentum indicator is basically a line that oscillates above or below a center line; with a value of 100.
It helps forex traders identify overbought and oversold market conditions. This shows whether there is enough momentum to sustain a trend.
For instance, when a market is overbought, the momentum indicator may show that the market is about to fall.
Alternatively, it may show that a market is getting ready to bounce on a falling, oversold market.
The momentum indicator is inherently present in the MT4 and MT5 platforms. The default setting for its number of periods is 14, but you can make changes according to your preferences.
The calculation behind the momentum indicator is:
Momentum = (current close / current close N periods ago)100
Once it’s added, the momentum indicator is displayed in a supplementary chart on the bottom of your main price charts.
Here is how it looks.

To trade using the momentum indicator, you can place buy orders when its value increases from below 100 and crosses over, and place sell orders when prices drop from over 100 to below.
To use the momentum indicator well, you need stay focused, or you may miss the right entry and exit points.
To increase your chances of making profits, it is best to combine the momentum indicator with other indicators, such as the MACD.
You may also smooth out the momentum curve using a Simple Moving Average (SMA).
-
Stochastic
The Stochastic oscillator works like the momentum indicator in that it helps traders identify potential trend reversals.
This indicator works by measuring the closing price of a currency pair relative to the trading range within a defined trading period.
Within the chart, the stochastic is composed of two lines. There is the indicator itself, which is denoted by %K, and a 3-day Simple Moving Average of the %K, which is denoted by %D.
The oscillator is beneficial in identifying overbought and oversold market conditions.
It has a scale of between 0 and 100; readings above 80 indicate overbought conditions while readings below 20 indicate oversold conditions.
Furthermore, any crossovers that may occur in these outer ranges are particularly strong signals.
Here is how it looks.

-
Moving Average Convergence Divergence (MACD)
The MACD is a simple line that plots the average price of a currency pair for a designated time period.
The most common periods are one year, 200 days, 40 days, 1-day, 12-hour, 4-hour, and 1-hour.
This is useful in identifying new trends to indicate whether the market is bearish or bullish for a currency pair.
The MACD settings has three numbers you need to take note of:
- Faster-moving average
- Slower-moving average
- Moving average difference (difference between the faster-moving and slower-moving averages)
The three numbers are usually denoted as separated by commas for quick and easy interpretation. For instance, “11, 25, 8” can be interpreted as:
- 11 is the previous 11 bars of the quicker moving averages.
- 25 is the previous 25 bars of the slower moving averages
- 9 is the previous 9 bars of the difference between the faster and slower moving averages. On the MetaTrader platform, this is usually displayed as the histogram.
Here is how it looks.

The histogram displays the plotted difference between the slow and quick-moving averages. Where there is a big price difference, the histogram bars get bigger.
On the other hand, when the moving averages price difference is smaller, the histogram bars get smaller.
The moving apart (getting bigger) is called divergence while the coming together (shrinking price difference) is called convergence.
The two moving averages are easy to read. Since they are moving at different paces, the quicker average will react faster to price movements.
Hence, the quick line will change direction and cross over the slower line. After the crossover, the quick line builds a divergence further from the slower one, indicating the formation of a new trend.
The one disadvantage of the MACD indicator is that it uses historical data to plot the moving averages. Thus, the moving averages typically lag behind real time price fluctuations.
By using multiple moving averages, they smooth out the plotted lines making the lag shorter. Despite this disadvantage, the MACD is one of the most popular indicators for forex traders.
Click here to read more about the MACD indicator.
-
Relative Strength Index (RSI)
The RSI is an oscillating leading indicator, meaning that it pre-empts price events on the charts. Therefore, when trading, you will get an early signal of coming price shifts. The disadvantage is that these signals are often false and premature.
To safeguard against this, it’s advisable for traders to use the RSI in combination with other trading tools for confirmation.
To install RSI to your MetaTrader platform, go to the standard menu and click on “Insert,” then “Indicators,” then “Oscillators,” and finally “Relative Strength Index.”
This automatically attaches the RSI tool to the lower part of your chart with its default 14-period setting.
The RSI is a single line that moves between 0 and 100. This area is divided into three primary price zones.
- 1 – 30: Oversold zone
- 30 – 70: Neutral zone
- 70 – 100: Overbought zone
The RSI’s default setting is calibrated as N = 14 periods. Using this setting:
RSI = {100 – [100 / (1 + RS)]}
The RS variable is calculated using the Exponential Moving Averages (EMA) as:
RSI = (14 EMA on the most recent up bars on the chart / 14 EMA on the most recent down bars).
The RSI indicator is used to indicate three basic signals:
- RSI overbought: This is when the plotted line moves into the 70 – 100 area
- RSI oversold: This is when the plotted line moves into the 30 – 0 area
- RSI divergence: In this scenario, the RSI diverges from the prevailing price action, signaling a potential market reversal
The RSI divergence may be either bullish or bearish. A bullish divergence occurs when the price action decreases as the RSI line increases.
A bearish divergence is indicated by increasing price action against a decreasing RSI line.

To enter an oversold or overbought position, you sell or buy immediately the price action crosses the RSI threshold.
To enter on divergence, you enter the trade in the RSI’s direction once the price action has closed 2 or 3 candlesticks in a row in your intended trade’s direction.
The RSI may provide premature signals or entirely false signals. To protect against risk, you need to put a stop loss. The ideal stop loss is placed beyond the most recent swing bottom or swing top.
It makes sense to maximize your profits by exiting your trade only when you get an opposite trade recommendation from the RSI indicator.
-
Commodity Channel Index (CCI)
CCI is a popular forex indicator used to identify oversold and overbought market conditions.
However, unlike the RSI and stochastics which use 30 and 70 as determinant points, CCI uses +100 and -100.
Here is how it looks.

CCI works by measuring the current price against the average price for a given period, typically set to the default of 14 points.
Thus, CCI is low when prices are below their average and high when prices rise above average, which indicates the indicator’s overbought and oversold areas.
For example, to profitably use CCI, you can place a buy order on a strong downtrend at the oversold point; where other traders are no longer selling. This is when the CCI has risen over the -100 point.
How Top Traders Use Indicators on MetaTrader To Reap Big
Do you always seem to be the last to notice a forex market trend? Are you always missing out on the big profits and only just catching the tail end of a trend or reversal?
The top forex traders know the money is in accurately and reliably getting the timing of sudden price shifts.
While we have highlighted only a few of the most popular indicators to use on MetaTrader, there are hundreds more you can choose from the MetaTrader market.
Additionally, most of the top traders pay some dollars for customized indicators that give more accurate and reliable signals for their particular trading strategies and chosen currency pair.
Remember, you do not need to commit to an expensive indicator right off the bat at full price. You can always start with a free version to learn its ins and outs.
For the best trading experience, purchase a simple but effective mix of indicators and continuously tweak your strategy for sustainable forex profits.
Happy trading!