Introduction
In brief, Fibonacci numbers or ratios are mathematically significant numbers that are present in our environment and usually in the financial markets. The numbers were discovered by Leonardo de Pisa, a renowned Italian mathematician, in the 13th century.
How are Fibonacci ratios calculated?
The Fibonacci series of numbers are:
1, 1, 2, 3, 5, 8, 13, 21, 34, 55, 89, 144,….
The numbers are derived by just adding the two previous numbers together:
For example, 3 +5 = 8, 5+8=13, 8+13=21, etc
Let’s analyze how the ratios are calculated.
If you take four sequential Fibonacci numbers, for example, 13, 21, 34, 55.
Dividing one number with another gives us the Fibonacci ratios:
13/21 = 0.618 or 61.8%
34/55= 0.618 or 61.8%
34/21=1.618 or 161.8%
55/34=1.618 or 161.8%
21/55=0.382 or 32.8%
13/34=0.382 or 32.8%
The square root of 0.618 = 0.786
Also, the square root of 1.618 = 1.27
In the foreign exchange market, the key ratios are:
0.382 (38.2%), 0.50 (0.50%), 0.618 (61.8%), 0.786 (78.6%), 1.27 (127%), 1.618 (161.8%), and 2.618 (261.8%).
The good news is that it’s not a golden rule that you need to master how to calculate all of these. The platform you use for trading will do for you all the work.
Nonetheless, it’s important that you be acquainted with the basic theory of how the Fibonacci indicator operates so that you can appropriately apply its signals.
How to trade forex using Fibonacci ratios
Fibonacci is a very powerful tool for navigating the forex waters with profit. Most currency traders use them widely to determine potential entry points and exit points.
The Fibonacci are usually very reliable because several successful traders around the world look at them. When this takes place, the traders, in mass, make the prices to reach these levels. Thus, they tend to become a self-fulfilling prophecy, if used correctly.
To increase their probability of success, professional traders combine the Fibonacci signals with that of other indicators such as candlesticks patterns, support and resistance levels, trend lines, and others.
Forex brokers usually include both Fibonacci retracement levels and Fibonacci extension levels tools in their trading software. When putting the Fibonacci levels on charts, it is important that you look for swing high and swing low points.
A swing high refers to the highest peak reached by the price of a currency pair, and it is usually formed with at least two lower highs on both the left and right of itself.
On the other hand, a swing low refers to the lowest trough reached by the price of a currency pair, and it is usually formed with at least two higher lows on both the left and right of itself.
In the subsequent sections, we’ll explain Fibonacci retracements and extensions and how to use them to increase the size of your trading account.
How to draw Fibonacci levels
As you will see in the diagrams below, to draw Fibonacci levels in a bullish trend, the swing low is connected to the swing high using the tool and the % values are given automatically by the trading software. The opposite is true for a bearish trending market.
Which timeframe is better for using the Fibonacci levels?
Depending on your trading style, you can apply Fibonacci ratios to any time frame. When used in larger time frames, like 4-hour or daily, the results will be applicable over the next several days, weeks or even months.
However, when used in smaller time frames, like 5 minutes, the results may not last for a long time because price will move away from the Fibonacci levels very soon.
Fibonacci retracements
It is of essence to note that the Fibonacci levels give more accurate signals when there is a major trend in the market. So, you should consider not using the tool in highly volatile market conditions.
The main Fibonacci retracement levels to watch are:
0.236 (23.6%), 0.382 (38.2%), 0.500 (50.0%, 0.618 (61.8%), and 0.764 or 0.786 (76.4% or 78.6%)
Fibonacci retracement levels are mostly used for identifying potential support and resistance areas on charts.
Because several market participants look at these same levels when placing their trades, the support and resistance levels tend to be self-fulfilling prophecy.
The idea here is that the market will retrace after a strong move before proceeding in its primary direction.
In a bullish market (uptrending), look for buy opportunities on a retracement at a Fibonacci support level. In a bearish market (downtrending), look for sell opportunities on a retracement at a Fibonacci resistance level.
To get these retracement levels, you should look for recent significant swing highs and swing lows on the charts.
Thereafter, for a bearish trending market, click on the swing high and drag the cursor to the most recent swing low.
On the other hand, for a bullish trending market, click on the swing low and drag the cursor to the most recent swing high.
Note that Fibonacci retracements can also be combined with other tools such as support and resistance, trend lines, and candlestick patterns to get more accurate signals.
a) Bullish trending market
Here is a daily chart of EUR/USD.
*Click to enlarge

As you can see from the chart, we applied the Fibonacci retracement levels on it by clicking the swing low at 1.2047 on 24th July and dragging the cursor to the swing high at 1.31727 on 17th September. The trading platform automatically gives the retracement levels.
On the chart, you can see that the retracement levels were 1.29033 (23.6%), 1.27442 (38.2%), 1.26019 (50.0%), and 1.24762 (61.8%).
So, the expectation is that if the currency pair pulls back from the recent high, it will find support at one of those Fibonacci levels before resuming with its major trend.
See what happens after the swing high was seen on the chart:
*Click to enlarge

Price retraced passed the 23.6% level and continued to descend the ladders over the next couple of weeks.
However, the 38.2% level managed to contain the price, as no full candle was able to clearly close below it.
Consequently, the market resumed its bullish momentum and ultimately managed to break through the swing high.
You could be smiling all the way to the bank if you placed a long term trade at the 38.2% level.
b) Bearish trending market
Now, let’s see how to use the Fibonacci retracement tool in a market ruled by the bears.
Below is a 4-hour graph of AUD/USD.
*Click to enlarge

As you can see from the chart, the swing high for the currency pair is at 0.95422 on 6th November and the swing low is at 0.92672 on 11th November. The retracement levels are 0.93325 (23.6%), 0.93724 (38.2%), 0.94061 (50.0%), and 0.94370 (61.8%).
The expectation in a bearish market is that if price pulls back from the swing low, it will meet resistance at one of the Fibonacci levels, as market participants will be waiting to place short trades there.
See what happens after the retracement occurred:
*Click to enlarge
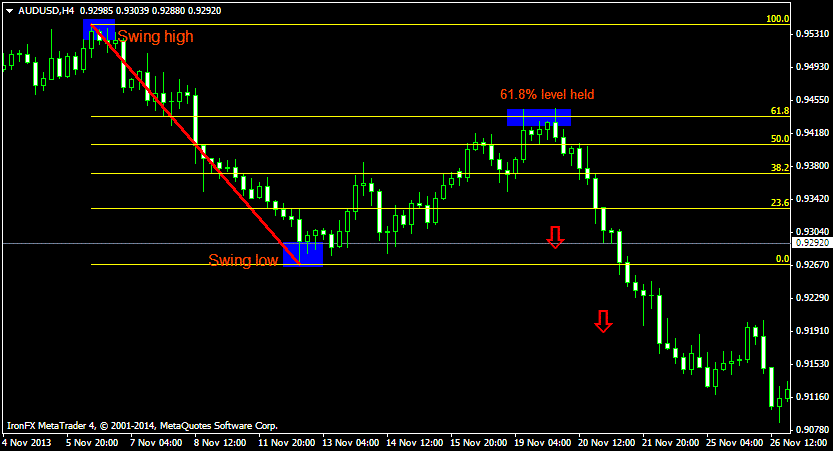
The market resumed its primary downtrend and continued to rally, even breaking past the swing low.
If you had placed some sell orders at either the 50.0% or the 61.8% level, you’d have banked some good amount of pips on the trade.
The above examples illustrate that price found some momentary support or resistance at the Fibonacci retracement levels. Therefore, these levels could be used as trade entry points.
It’s important to note that price will not always obey these levels and bounce off them.
Thus, you should not look at them as ‘holy grail’ areas. Importantly, you should combine the Fibonacci signals with other indicators to give you more reasons for entering a trade.
Fibonacci Extensions or Projections
The Fibonacci numbers are used by traders to get targets, especially after price has retraced. Fibonacci extension levels are usually established through using three simple mouse clicks.
In an uptrend, start by taking the tool and clicking on a major swing low on the chart, thereafter dragging your cursor and clicking on the most recent swing high.
Lastly, drag your cursor back down and click on any of the retracement levels.
This procedure will show each of the Fibonacci extension levels giving the ratio as well as the corresponding price levels.
The reverse applies when plotting the extension levels on a downtrend.
The main Fibonacci extension levels to watch are:
0 (0%), 0.382 (38.2%), 0.618 (61.8%), 1.00 (100%), 1.382 (138.2%) and 1.618 (161.8%)
a) Uptrend
When the market is trending upwards, the strategy is to take profits on a buy trade at Fibonacci extension levels because they tend to act as resistance areas.
Let’s see this on a chart:
*Click to enlarge

After sinking a little bit from its recent high, the pair finally resumed its upward move.
On the chart above, you can see that price sailed strongly towards the 138.2% Fibonacci extension level.
So, if you placed a long trade at the 97.26 level, you could exit the position at the 98.31 (61.8%), 99.00 (100%), or 99.76 (138.2%) level and take off your profits
b) Downtrend
When the market is trending downwards, the idea is to take profits on a sell trade at a Fibonacci extension level because the areas tend to act as support.
Let’s see this on a chart:
*Click to enlarge

After retracing a little bit, the pair finally resumed its downward move (buyers were unable to sustain the move up).
So, if you placed a short trade at the recent swing high, you could exit the position at the 99.37 (61.8%), 98.69 (100%), or 98.01 (138.2%) level and take off your profits.
All of these zones acted as support, maybe since other traders are also keenly looking for them to exit their trades.
As the above examples point out, the market sometimes gets temporary support or resistance at the Fibonacci extension levels.
So, you can use these levels to appropriately adjust your position and exit your trades with some profits.
Remember that no one tool is perfect in the forex trading world, including Fibonacci numbers. However, with determination and constant practice, you’ll make better trade decisions when using these tools.
Summary
Fibonacci retracement levels are mostly used by forex traders to determine support and resistance zones in the market.
Fibonacci extension levels are mostly used by traders to establish possible support and resistance zones in order to set profit targets.
To make the most of Fibonacci levels, you’ll need to know how to identify swing high and swing low points on charts.
The weight of the Fibonacci signals become more important when combined with other strategies, such as support and resistance levels, trend lines, and candlestick analysis.