Moving averages are one of the common strategies used in forex trading. A moving average simply refers to a method of smoothing out price fluctuation over a specified time period.
What it does is simply to remove the noises and make the charts easier for interpretation. As such, they can help you to make a good decision to either buy or sell a currency pair.
A moving average is usually calculated by adding the closing price of a currency pair for a number of time periods and then dividing this total number by the number of time periods.
Just like other indicators in forex trading, moving averages are employed by traders to assist them to identify potential trade opportunities.
It is important to note that moving averages indicators are lagging indicators. This implies that they work with delay and are unable to adjust quickly to volatility in the market.
As it was mentioned earlier, moving averages simply smooth out price fluctuation of price action in the market. Several types of moving averages are present, which have their own level of “smoothness”.
In general, we have found that a smoother moving average (long-term moving averages) reacts to price action much slower than choppier (short-term moving averages) moving averages. In other words, choppier moving averages react to price action much faster than smoother moving averages.
If you want to make a moving average smoother, then you ought to calculate the average closing price of a currency pair for an extended period of time.
The three common types of moving averages are:
- Simple moving average
- Exponential moving average
- Weighted moving average
- Simple moving average (SMA)
Simple moving averages are the most widely used type of moving averages in the forex world. They are also referred to as arithmetic moving averages.
Generally, they are calculated by adding up the closing price for a number of time periods (let’s say X) and then dividing this total number by the number of time periods (X).
As an example, if you want to plot a 10 period simple moving average on a 60-minute chart of EUR/USD, you would add up the closing prices for the previous 600 minutes (60×10) or 10 hours, and then divide that number by 10.
And, in this case, you will have the pair’s average closing price for the previous 10 hours. If you go ahead and join those closing prices together, you will come up with a moving average. It is that simple.
However, the good news is that you won’t be required to calculate the simple moving averages every time you want to use them for trading, as most trading software will automatically do all these on your behalf.
Understanding how an indicator operates will help you know how to edit and adjust it to resonate well with your tastes and preferences in trading.
Furthermore, you can easily tailor any strategy according to the market conditions if you know how an indicator works.
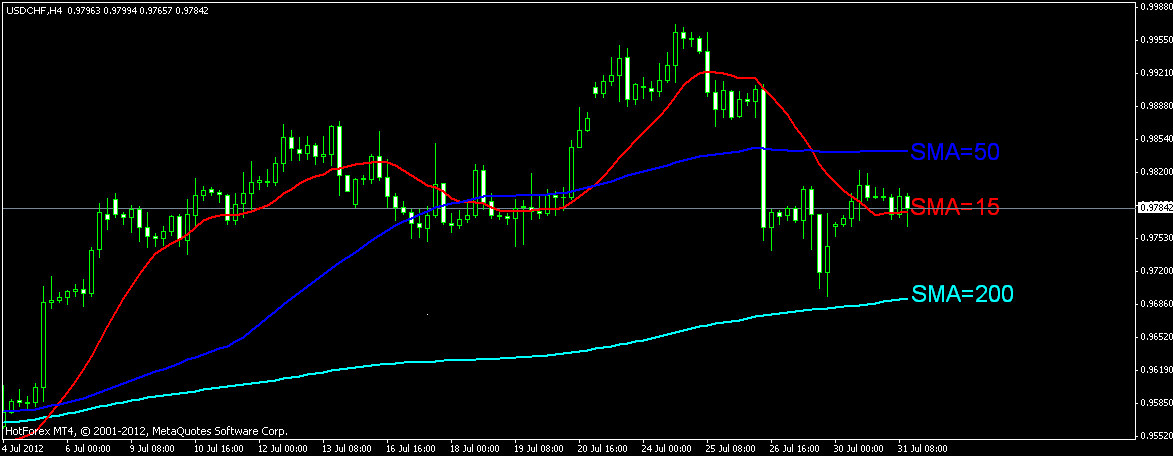
The following diagram shows simple moving averages on USD/CHF 4-hour graph
The above diagram clearly illustrates that the longer the period of the simple moving average, the more it lags behind the price.
In other words, a longer simple moving average reacts to price action slowly than a shorter period simple moving average.
The 200 SMA is some distance away from the current price than the 50 SMA and the 15 SMA. This is because, as it was mentioned earlier, the 200 SMA adds up the closing prices of the previous 200 periods and divides it by 200.
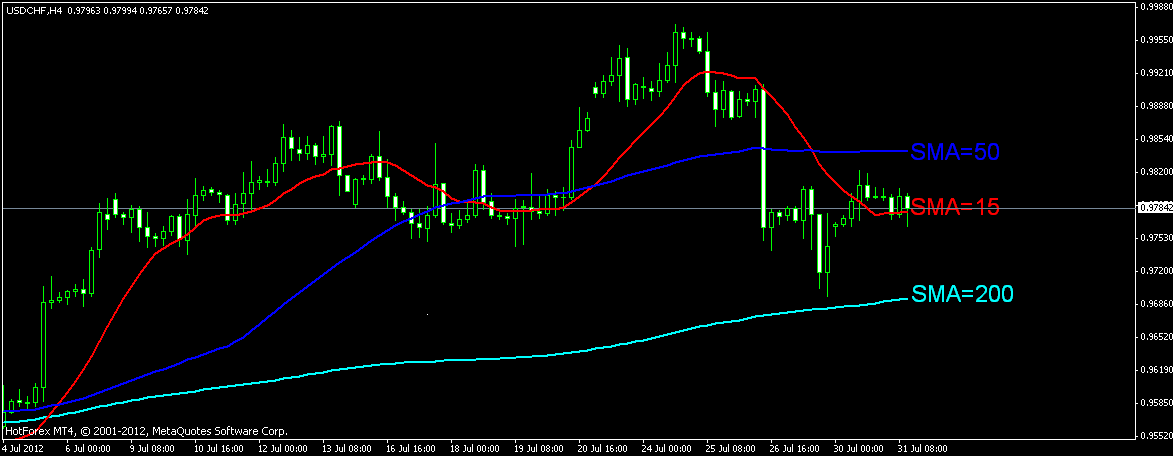
Simple moving averages play an integral role in depicting the overall sentiment of the market; that is, whether the market is on an uptrend, downtrend, or trading within a range.
The above diagram illustrates that the market is trending up.
Rather than just giving the present conditions of the market, moving averages help traders to determine the big picture and thus identify potential trade opportunities.
Besides its benefits, one major weakness of the simple moving average is that it is vulnerable to spikes, which can give false signals to traders. A trader may think that a new trend is about to emerge while in real sense nothing serious took place.
Advantages of simple moving average
- A longer SMA gives better ideas of the overall trend
- Since it responds slowly to price action, it can prevent you from the dangers of false breakouts
Disadvantages of simple moving average
- It is slow moving and this can lead to a lag in generating signals for trade. And, this is what causes delayed entry and exit of trades.
- Exponential moving average (EMA)
Exponential moving average is just the same as a simple moving average, with the exception that more weight is given to the most recent periods.
In this way it eliminates spikes that may give false signals. The exponential moving average can also be referred to as exponentially weighted moving average.
Since the exponential moving average moves faster than a simple moving average, this means that it has less lag (delay).
To put simply, exponential moving average stresses more on what traders are doing recently.
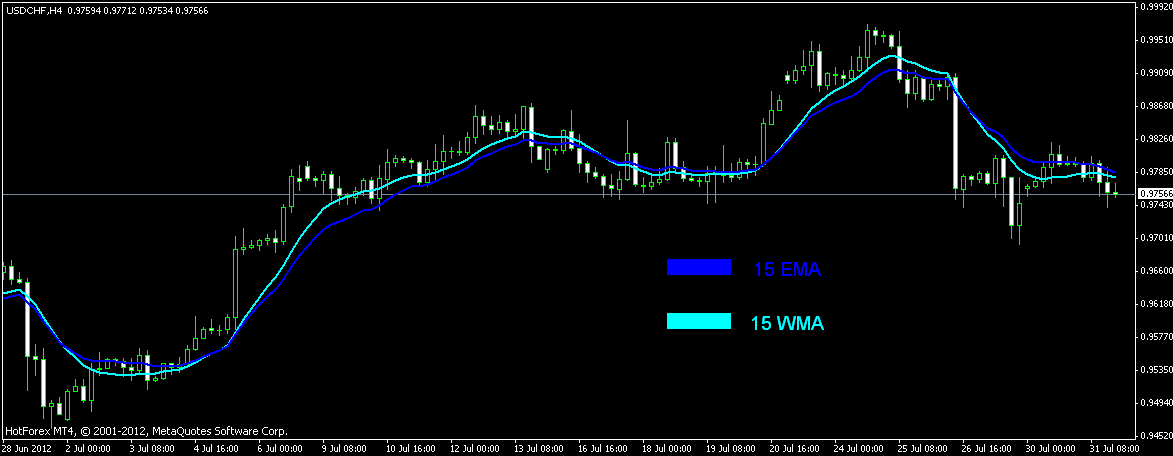
When SMA and EMA are plotted together on a chart, their differences become even clearer:
As the diagram illustrates, the 15 EMA seems to be closer to the price action than the 15 SMA.
Therefore, it implies that EMA represents price action more accurately, as it puts more weight on what has been recently taking place in the marketplace.
In the forex market, it is more essential to see what is currently taking place than what took place sometime ago.
Advantages of exponential moving average
- A shorter period EMA responds to price action quickly and thus assists in identifying trends early enough
Disadvantages of exponential moving average
- It is more susceptible to cause false breakouts and thus give misleading signals
- Weighted moving average (WMA)
The weighted moving average also places greater importance on the recent price action to make the moving average faster.
The weighted moving average puts even greater importance on recent data than the exponential moving average does.
The following diagram illustrates this:
So, which moving average is the best for trading?
There is no moving average that out-performs the other when it comes to trading. Whereas they have their own weaknesses and strengths, it is at your own discretion to choose the one that resonates well with your style and preferences in trading.
Most traders plot different kinds of moving averages on the same chart to help them get both sides of the story.
For example, they may plot a longer SMA to know the overall trend of the market. Thereafter, they may plot a shorter period EMA to assist them in identifying the best places to enter and exit the market.


You actually make it seem really easy with your presentation however I find this matter to be really one thing that I think
I would never understand. It kind of feels too complicated and extremely
extensive for me. I am taking a look ahead on your subsequent put up, I’ll
attempt to get the dangle of it!
You’ll achieve it- one step at a time. All the best. Do not hesitate to contact us if you need more help.