Introduction
The Stochastic indicator was developed by George C. Lane and introduced to traders in the 1950s. It was one of the essential technical indicators employed by traders for forecasting the possible market movements in the future.
The Stochastic is an oscillating indicator, which means it uses a scale to gauge the level of change between prices from one closing period to the next.
This way, it tends to foretell the possibility for the continuation or reversal of the current direction of the prevailing trend. Traders usually search for signals given by the actions of the Stochastic’s lines as seen on its scale to assist them in making trade decisions.
Basics of the Stochastic oscillator
The Stochastic indicator is usually scaled from 0 to 100. It comprises of two lines: the %K and the %D.
- The %K is the main line identifying the number of time periods, and it tracks the present price of a currency pair in the market.
- The %D is the moving average of the %K, and it’s also referred to as the signal line.
Knowing how the Stochastic is derived is one thing, but understanding how to effectively interpret its signals is more significant.
How to interpret Stochastic lines
The stochastic indicator usually generates three kinds of signals:
- Crossovers
- Divergence (how strong a trend is)
- Overbought / oversold conditions
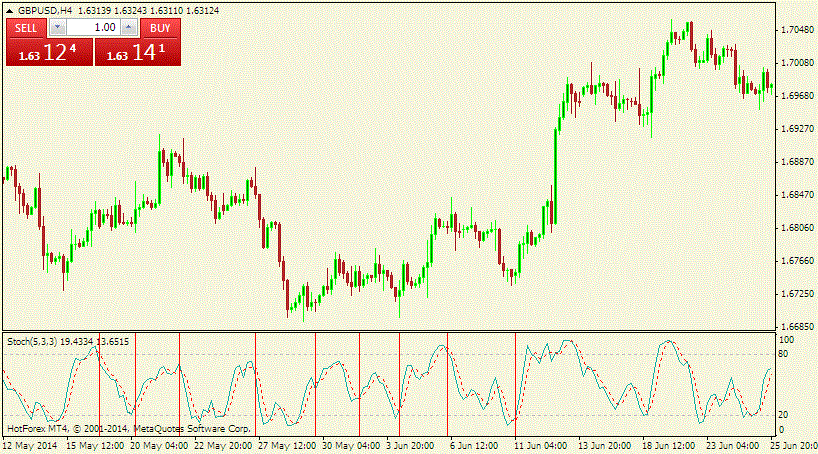
Crossovers
- A crossover takes place if the %K line (the quick stochastic) crisscrosses the %D line. The % D line is the slow moving stochastic.
- Since the %K line responds faster to the changes in the market conditions, it oscillates much quicker than the %D line. In some situations, it can pass, and crisscross, the %D line.
- If the %K stochastic line crosses and goes over the %D stochastic, then this implies that the momentum is increasing at a quicker pace than the average given by the %D stochastic. Therefore, traders usually interpret this as a signal to enter buy orders.
- On the other hand, a sell signal is generated when the %K stochastic crosses below the %D stochastic. This happens because the quick %K line is reducing at a faster pace than the overall, downward trend.
Here is a diagram of an example of %K stochastic crossovers:
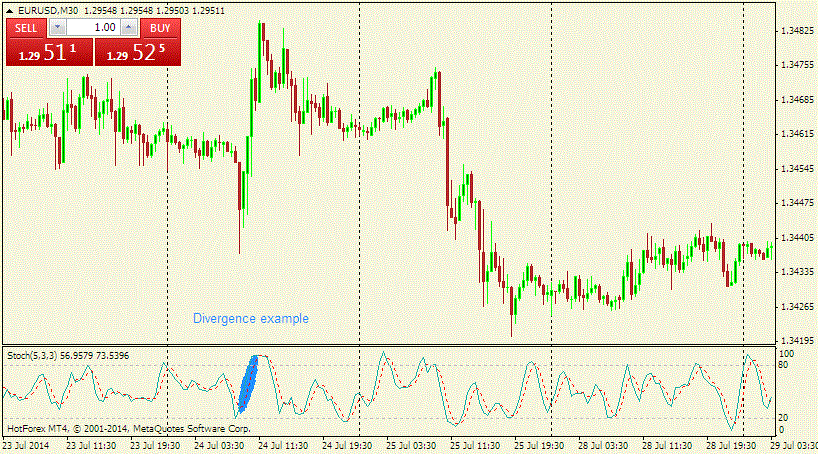
Divergence
- Basically, divergence refers to the difference, or the separation, that is seen between the %K and the %D stochastic lines.
- Since the %K line is much quicker than the %D line, the divergence existing between the two stochastic lines widens as the market trend gains more momentum. On the other hand, the lines usually come close together when momentum starts to die off before a reversal takes place
Here is a diagram of an example of stochastic divergence:
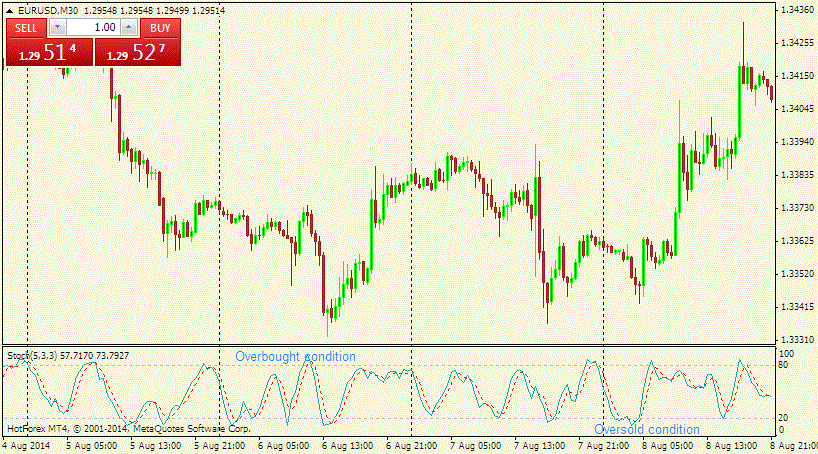
Overbought and oversold conditions
- If the %K line sails above the 80 region in the stochastic scale, traders usually interpret this to mean that the asset is overbought. Thus, this could result in a sell-off making the price to go downwards.
- On the other hand, if the %K line lowers below the 20 region in the stochastic scale, traders usually take this as a signal that the asset is oversold. In that case, they may start placing buy orders making the price to go upwards.
Example is here below: