Invented by the famous technical trader John Bollinger in the early 1980s, Bollinger bands are used in measuring the level of volatility for a currency pair in the foreign exchange market.
Most traders are interested in knowing the level of volatility in the market since a quick increase in volatility is usually the prelude to a change in trend of the market.
Bollinger bands usually come with most modern trading platforms, and it is placed over a price chart to assist in identifying potential trade opportunities.

Bollinger bands explained
Bollinger bands comprise of a set of three curves drawn to reflect the price action of a currency pair: upper band, lower band, and middle band. The middle band is founded on a simple moving average while the outer bands are founded on standard deviations.
The default setting the Bollinger band uses is the 20 period simple moving average with a standard deviation of 2, and they are the ones that define pricing “channels.”
It is important to point out that these settings can easily be modified according to the needs and preferences of a trader.
The middle band determines the intermediate-term trend. In addition, it acts as the base for the upper band as well as the lower band.
The interval between the upper and lower band determines the relative volatility of a currency pair, and it is what Bollinger bands strategy seeks to analyze.
Bollinger bands interpretation
In the forex market, the prices of currency pairs usually have the tendency to rise or fall slowly over the longer term according to the long term average.
For sure, price often rises and falls in the short term, as bulls and bears try to measure their strength.
However, these short term fluctuations in price, sometimes portrayed by high volatility, do not usually last long. And, eventually price usually goes back to the longer term moving average.
The standard deviation of the upper band and the lower band, which is a major determinant of volatility, indicates how far prices have shifted away from the long term moving average or fair value.
In fact, the standard deviation of the upper band and the lower band measures how far they have deviated from the average mean (the middle band).
Bollinger bands technical analysis looks at how the outer and lower bands adjust themselves to the prevailing market conditions.
In cases where the market is very volatile, the upper band and the lower band expand; that is, they tend to move further away from the longer term moving average.
And, in cases where the market is not very volatile, the upper band and the lower band contract; that is, they tend to move closer to the longer term moving average.
The consolidation of the bands is usually employed by traders as an early Bollinger band signal that a price breakout is about to take place.
The Bollinger bands indicator is one of the most popular ways of identifying potential trade opportunities in the forex market.
When price moves towards the upper band, it indicates that the market is overbought, and bears are about to gain control. On the other hand, if price moves towards the lower band, it indicates that the market is oversold, and bulls are about to gain control.
An important thing about Bollinger bands interpretation is that price has a tendency to return to the middle band, regardless of how far it may wonder from it.
Even if price moves towards the upper or lower band, eventually it would settle back down towards the middle area of the bands.
This is the main reason why price bounce back and forth between the bands. Essentially, the bounce in price takes place because Bollinger bands function just like dynamic support and resistance levels.
How to use Bollinger bands in forex trading
There are various ways in which Bollinger bands can be used in navigating the forex waters:
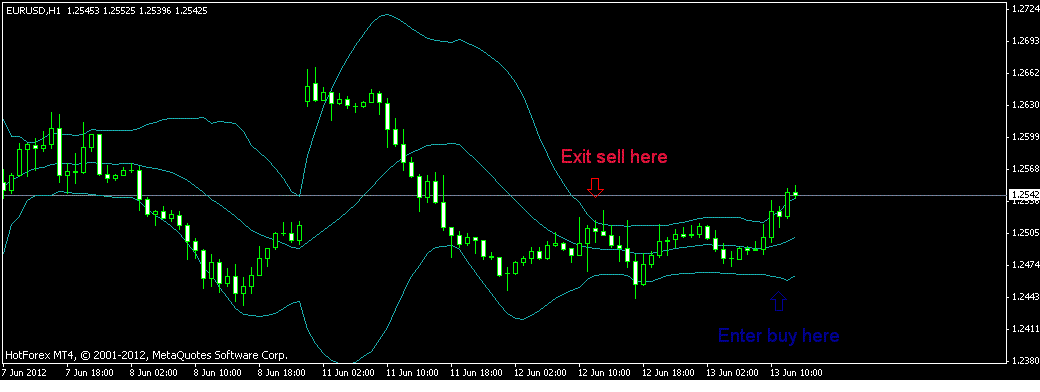
- Identifying areas to place and exit trades
In situations when the lower band and the upper band are further away from one another, Bollinger bands indicator can be used to determine when to close open positions and lock in profits.
In other instances, they can be employed in opening contrary positions to the existing trend – either searching for swing trade opportunities or establishment of new trends.
The example below illustrates how this can be used:
*click to enlarge picture
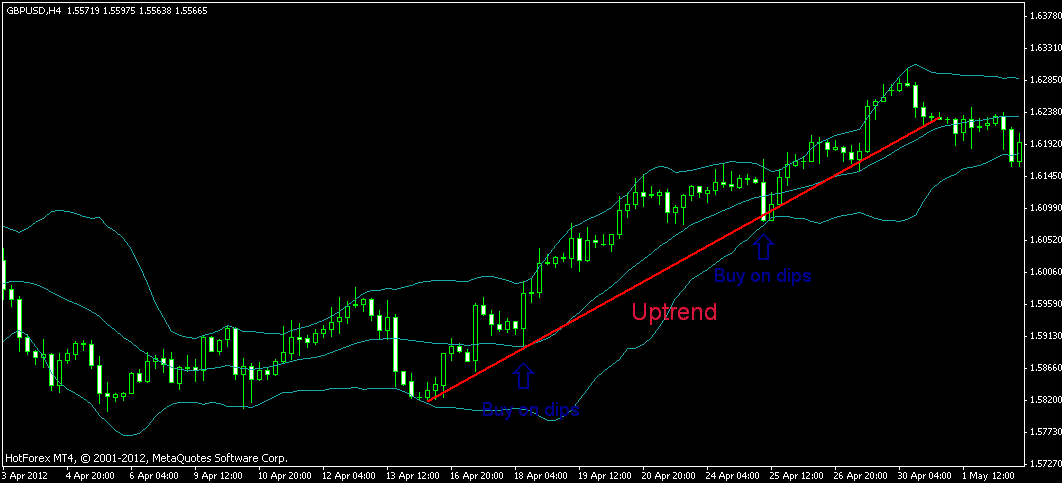
2. Entering trends in motion
When a strong trend is present in the market, it normally tends to experience dips back to the middle band.
Therefore, these can be employed in opening new positions after careful analysis has been carried out.
It is of essence to note that in a strongly trending market, the middle band provides a low risk area for placing trades.
The example below illustrates how this can be used:
*click to enlarge picture
3. As a warning
As earlier mentioned, if the price of a currency pair is trading within a tight range and volatility is not high, it normally signifies that a price breakout is about to be witnessed in the market.
In Bollinger bands technical analysis, low volatility tends to be a prelude of a higher volatility. In addition, this can be a warning of an impending change in trend.
Thus, when there is a change from low to higher volatility as given by Bollinger band signals, it often serves as an advance warning that this volatility will result in a change in trend.
Important considerations when using Bollinger bands
- Bollinger bands strategy should not be used on its own for indentifying trend reversals as well as entry and exit points. Other strategies such as support and resistance, trend lines, momentum indicators, and others should be combined with this strategy.
- Bollinger band signals tend to be more affirmative when retrieved from the longer time frames. As such, it is advisable to plot Bollinger bands on longer time frames such as 1hr, 4hr, or 1 day. When used in shorter time frames, Bollinger bands may give false signals.