If you are thinking about which forex trading time frame to follow and which to avoid, I will suggest you follow the longer time frames (1 hour, 4 hour, daily, and weekly charts) rather than shorter time frames (1 min, 5 min, 15 min and 30 min charts).
You may find a lot of noises in shorter time frames compared to longer time frames.
The basic reason why shorter time frames have more false signals compared to higher time frames is because there are more pointless price movement on 15 minute charts than on 4 hour charts.
So, you may get false signals more frequently on shorter time frames whereas on longer time frames you will get less signals but they will be more profitable.
I always like to say “Go for Quality trading not Quantity trading”.
To make money in the forex market, you don’t need to trade 20 or 30 times in a day.
You can make money only by trading 1 or 2 times in a day. But you have to ensure that you avoid trading until you get true price action signals.
You will not get a very well-built directional movement in a 1 minute or 5 minute or 15 minute chart signal; you will get lots of little pointless movements.
You will get a much more strong directional movement in a 1 hour chart and even more in a 4 chart. Furthermore, a daily or weekly chart will give you even better and stronger trade signals.
You can always expect more strong movements from higher time charts.
If you trade on a shorter forex trading time frame, you may engage in over trading, which is also known as entering in to the market when no price action signal is present.
Nevertheless, I must say that trading on lower time frames, like the 1 minute and 5 minute chart, is one of the main reasons why most forex traders fail too often.
If you follow shorter time frames, you have to be in the market for the whole day because you don’t know what signals are coming after each 5 minutes or 15 minutes.
However, if you follow longer time frames, like 4 hour or daily charts, you don’t have to sit in front of your computer all day long.
You can monitor the market once in every 4 hours or twice in a day!
I always like the “set and forget” strategy. This strategy is only applicable for a longer time frame.
For this strategy, you have to do your calculation before entering the market, and after your entry, set your stop loss and take profit levels. Thereafter, just be outside of the market and let it do its “ting”.
Here, I have placed an example to show why I don’t like to trade lower time frames and why I suggest you trade longer time frames, especially if you a beginner trader.
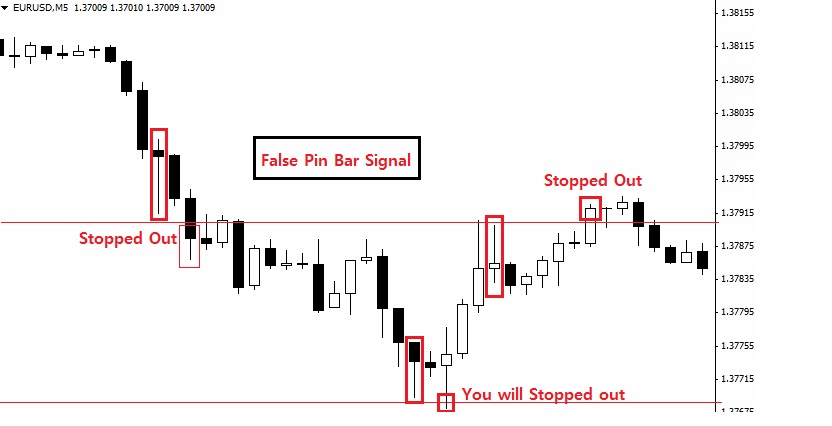
On EURUSD 5 min chart (New York Close Chart), we can see most of the pin bar is giving a false signal.
So, if you entered the market following price action signals of 5 min chart, you may lose your money too quickly.
(Click to enlarge image)
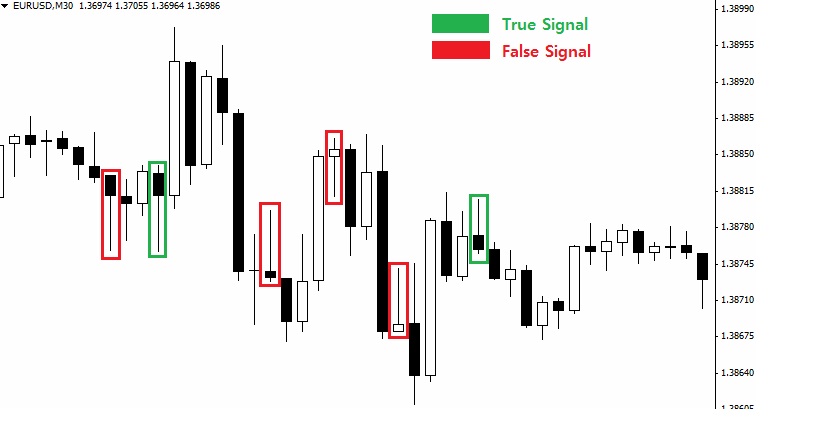
Same thing happened on EURUSD 30 min chart (more false signals rather than true price action signals).
(Click to enlarge image)
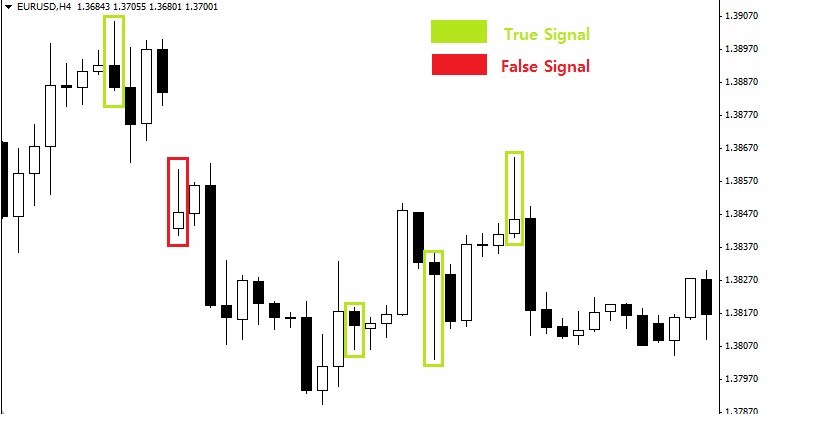
 Now look at the EURUSD 4 hour chart: You can see the difference, as you will get more true price action signals rather than false signals.
(Click to enlarge image)
Take a look on EURUSD daily chart: Here we can see that price action signals will not come every day. However, when it comes, it will be a true price action signal and you can start smiling at your bank account. A profitable trade here! 🙂 (Quality trading)
(Click to enlarge image)
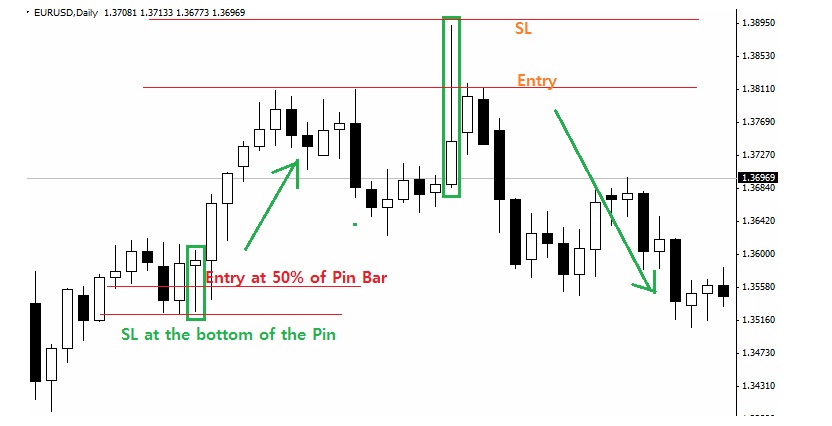
Always you have to keep in mind that you can’t control the market but you have to move along with the market.
It’s important to note that there is no any sure shot in forex. But by following longer time frames, you can avoid a lot of false price action signals.
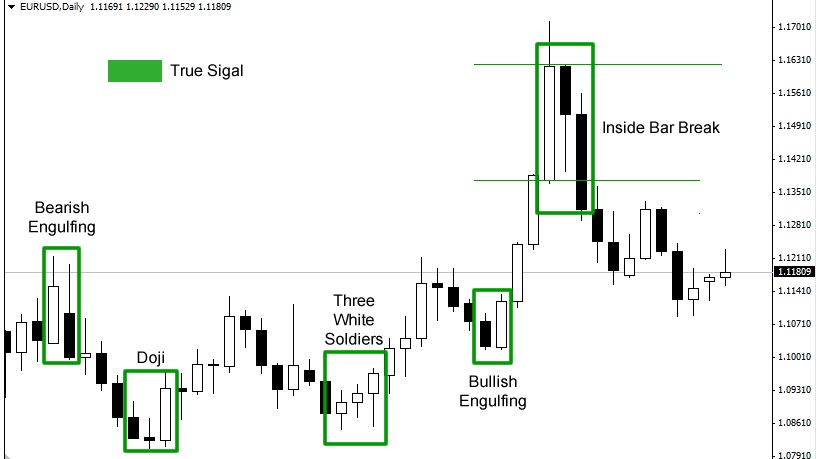
In the following EURUSD daily chart:
- On 13th July, 2015 we had a Bearish Engulfing pattern (second candle is followed by a sell off that engulfs the body of the first candle indicating that the bears are gaining ground) signal and then price fell short.
- On 20th July, 2015 we had a profitable Doji (an indication of market indecision when a reversal is imminent) sign at the swing point and then a bullish candle indicating that price will go long.
- On 5th August to 7th, 2015 we had Three White Solders (Three long white sessions with higher closes each day indicating powerful buying action is at work), and hence price went long.
- On 19th August, 2015 we had a Bullish Engulfing (first candle reflects trend; second candle’s body engulfs size of first candle’s body when a reversal is indicated) signal and hence price moved higher.
- On 26th August, 2015 we had an Inside Bar breaking signal and then price went down.
(Click to enlarge image)
Would you like to check the market every 5 minutes or every 4 hours? The higher the time frame, the less you have to check the market.
If you have a full-time job or you are a full-time student, you may lack the time to sit at the computer for the entire day trying to trade 5 minute charts.
It’s also a lot more stressful. So, it really just makes no sense to try and ‘force’ money out of the market by scalping or day-trading the lower time frames.
Key Note:
- Try to avoid shorter forex trading time frames, like 5 min charts, 15 min charts, 30 min charts, and in some case hourly charts too.
- Try to follow longer time frames, like 4 hourly charts, daily charts, and weekly charts.