Guest post by Justin Cahoon, Inovance
“…visual backtesting – scanning over charts and applying new methods to the data you have on your selected time frame – is crucial.” [Source: Investopedia].
Visually scanning your chart to come up with a strategy is not crucial. In fact, visually scanning your chart and indicators to test strategies will be detrimental to your trading.
Humans Are Really Good at Finding Spurious Strategies
When I was first learning how to trade, I would research indicators and learn how to trade them, then I would load up the indicator on a chart and see how it behaved, scrolling through looking for patterns in my data.
Once I thought I saw a pattern, I formed my entry rule and added some exit criteria. Before I knew how to code up my strategy I wrote out my strategy rules and meticulously recorded the open, high, low, close and what my return would have been.
Here are a few reasons why this method will not work.
1. We find meaningless patterns.
Let’s take a look at a mystery stock chart:
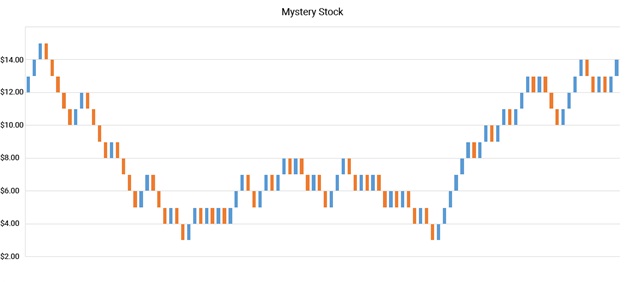
What do you see? There is some good support at about $3.00 and some obvious resistance at $14.00.
Looks like we have been recently testing that $14.00 mark and might break out just like we did the $8.00 two weeks ago, right? I’d put a tight stop loss and a high take profit if I saw that stock move above $14.00.
Unfortunately, the chart above was generated using 100 coin flips, heads were plotted as blue, up bars, and tails were plotted as red, down bars.
The next bar is just as likely to be down as up. If the next bar was up and you said it was going to be up, you would think you were on to something.
The point is, when we try to analyze a lot of data, visually, we make mistakes and we see patterns that are not there.
We often find exactly what we are looking for instead of seeing what is really there.
This would be a lot less likely to happen if we could analyze a lot more data. We would start to see that the patterns we thought we saw this week or this month didn’t hold up over the past two years.
2. Your pattern doesn’t hold up over time
The chances of you finding a recurring pattern in your data, that is going to recur in the future just by scrolling through your chart is 0%. Here is why:
- You need to analyze too much data to find anything statistically significant.
- There are so many factors that influence the price of an asset, especially the price of a currency and especially the exchange rate between two countries. A lot of the indicators you are going to test are not going to contain any information whatsoever. You need a way to test a lot of different indicators in a relatively short period of time.
- Markets conditions change. You may find a pattern that holds up over trending markets. You were able to test this pattern over the past few months but as soon as you start trading live, the market conditions changed and you haven’t tested your pattern/strategy over different market conditions.
3. It’s hard to remain disciplined
When you are building or testing your strategy directly off a chart, you start to tweak it.
Your take profit was 40 pips but you see that you could have exited a trade profitably with a take profit of 42 pips.
Your entry condition is to enter when the RSI is dipping below 70 but you see you could have had a beautiful trade if you entered at an RSI value of 69 instead. Slowly but surely your strategy starts to change.
This is easy to do when you are backtesting your automated strategy as well.
You run a backtest and change your stop loss from 40 pips to 50 pips and see your accuracy went up by 1% so you increase it again from 50 pips to 60 pips but now you have increased your risk per trade by 33% just because the date range you were testing over happened to have a few more trades work out with a higher stop loss.
This issue is known as overfitting. Overfitting is when you fit your strategy to match the noise in your data.
So, given all these issues, how do we find reliable, recurring patterns and stay disciplined?
How to Find Reliable, Recurring Patterns for Your Strategies and Remain Disciplined
First, staying disciplined: Use data analysis software to help guide you. There is plenty of software (TRAIDE, Excel, Stata, R) out there that will nudge you in the right direction. You will never be fully protected since the final decisions are up to you so make sure you follow best practices.
Now, building reliable, recurring patterns: We need to test a large amount of data to capture many different market conditions and to be sure we are not overfitting.
The best way to see all this data in a comprehensive way is to look at a histogram of each indicator for all the data you want to analyze.
Why a histogram? In a histogram, you can see tens of thousands of data points at once and clearly see any patterns that emerge.
Here is an example of an RSI (14) on a 1-hour EUR/USD chart plotted in a histogram from 01/01/2014 to today (11/04/2015) in a histogram. Since there is so much data (11,328 bars), we grouped the indicator ranges into 11 bins.
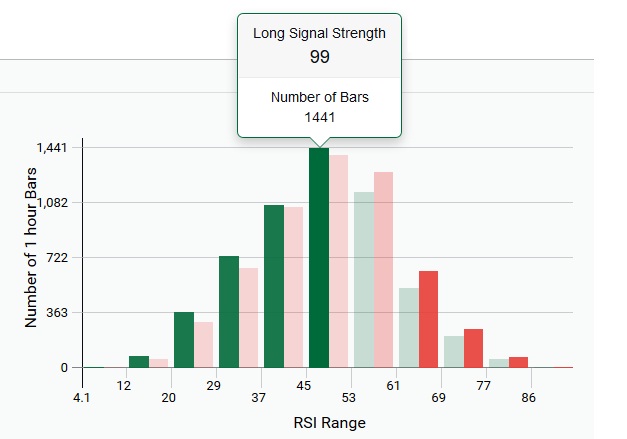
(Source: Generated using TRAIDE)
Reading the histogram: There are 1,441 bars that closed up (indicated by the green bars) when the RSI (14) was between 45 and 53 and there were 1,394 bars that closed down (indicated by the red bars).
*Note: Ignore the signal strength for now (displayed by the transparency of each bar).
Now that I can see all of the data in one graph, I don’t need to scroll through years and years of data.
It looks like the RSI (14) values that are valuable and might have some predictive power are between 12 and 37 for going long and between 61 and 86 for going short – we can tell by just looking at the difference between the red and green bars for each bin.
Now if you want to build a strategy, you know exactly where to start if you want to use the RSI (14) on the EUR/USD on a 1-hour chart.
This is just one example, I recommend doing this for every indicator you want to include in your strategy.